The well-known Preacher and Hayes macros for performing a bootstrapped test of mediation are designed to work only with SPSS or SAS. Those statistics packages are fine, but I prefer Stata. In this post, I provide Stata code for performing the Preacher and Hayes test. Continue reading “Stata code for performing the Preacher and Hayes bootstrapped test of mediation”
SPSS code for calculating the confidence interval of a Pearson correlation
For some reason, SPSS does not offer an option to calculate the confidence interval of an observed value of a Pearson correlation. SAS does it, and so does Stata. But SPSS doesn’t do it. Of course, SPSS will calculate the correlation itself. However, it will not calculate the confidence interval of the correlation.
The SPSS syntax below calculates the confidence interval. I’ve drawn on some code from the SPSS website; I’ve made the code easier to use and the results easier to interpret. I have verified the calculations against what I get using Stata, and the syntax calculates the confidence intervals correctly.
Continue reading “SPSS code for calculating the confidence interval of a Pearson correlation”
The effect of trimming outliers on a mean
It is well known that means are sensitive to outliers. Recently, I was asked what the effect would be on the mean if outliers from the distribution were to be removed from the analysis. Leaving aside questions of how to identify outliers and whether they should be trimmed, the question of how the mean would change if outliers are trimmed is addressed with this formula:
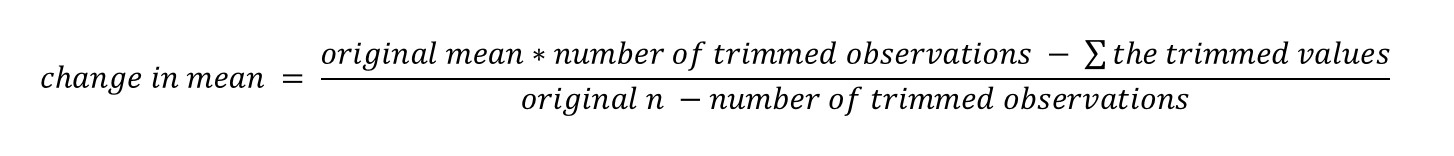
Consider an example with the original mean = 5.5 and the original sample size = 250. If three observations with “1” values were trimmed and another three observations with “7” values were trimmed, the change in mean would be (5.5 * 6 – 24) / (250 – 6) = .037. Therefore, the mean would increase by .037 (i.e., from 5.5 to 5.537).
– Eric DeRosia
Searching through Strings in Stata
In Stata, I needed to search some string values. I couldn’t use regular expressions because the strings I’m working with happen to contain regexp control characters. The following Stata code accomplishes the task without regular expressions: Continue reading “Searching through Strings in Stata”